
Introduction
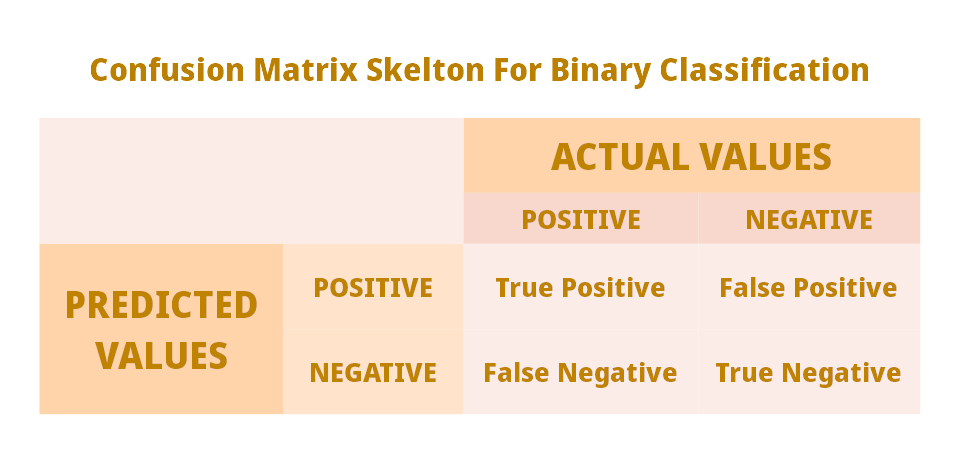
When it comes to an evaluation of a classification problem, the Confusion Matrix is one of the widely popular evaluation metrics. It is a matrix consist of the status of all the predictions and actual values divided into true positive, false positive, true negative, and false negative. We will see in a moment what all these things are.
Other than the above-mentioned terms, there are some other derived terms/metrics from the Confusion Matrix. In Python language’s Sklearn library following are calculated in the Classification Report. Along with Confusion Matrix, the following derived metrics are covered in this article:
• F1 Score
• Precision
• Recall
• Support
• Micro Average
• Macro Average
• Weighted Average
Before going for an example, let’s quickly understand these terms one-by-one.
True Positive
True Positive [TP] is the number of positive predictions that are actually positive means the actual values are positive and predicted is also positive.
POSITIVE -> POSITIVE
False Positive OR Type 1 Error
False Positive [FP] is a number of positive predictions that are actually negative and model predicted wrongly.
False Positive is also known as Type 1 Error.
NEGATIVE -> POSITIVE
True Negative
True Negative [TN] is the number of negative predictions that are actually negative and model predicted correctly.
The actual value is negative and the model also predicted negative that is the correct prediction of negative values.
NEGATIVE -> NEGATIVE
False Negative OR Type 2 Error
False Negative [FN] is a number of negative predictions that are actually positive and model predicted wrongly.
False Negative is also known as Type 2 Error.
POSITIVE -> NEGATIVE
Precision
Precision is a rate of positive predictions. Out of all the positive predictions how many are actually positive. The value of precision will be a floating-point value between 0 to 1. 1 indicates the best score and 0 for the worst score for positive predictions.
Following is the formula for identifying precision:
\begin{equation} \text {Precision}=\frac{T P}{T P+F P} \end{equation}
TP = True Positive
FP - False Positive
Recall
The recall is also a rate of positive predictions like precision but here from of all actual positives values, how many of them are found positive by model. The value of recall will be a floating-point value between 0 to 1. 1 indicates the best score and 0 for the worst score for actual positive predictions.</br>
Following is the formula for identifying recall:
\begin{equation} \text {Recall}=\frac{T P}{T P+F N} \end{equation}
TP = True Positive
FN - False Negative
F1-Score
F1-Score is like a mid-way to precision and recall as it is a weighted average of precision and recall. F1-Score changes based on a contribution by precision and recall.
Both precision and recall cannot increase or decrease together instead if precision increases then recall decreases and vice versa. F1-Score value is also a floating-point value between 0 to 1.
When F1-Score is 1 then we can say that contribution of precision and recall is equal.
Following is the formula for identifying f1-score:
\begin{equation} \text {F1-Score}=2 * \frac{Precision * Recall}{Precision + Recall} \end{equation}
Support
Support is simply a count of classification type in input data.
For example, if there is a classification problem with two classes ‘A’ and ‘B’ then the total number of ‘A’ present in input data is a support value of class A.
So, if there are 10000 records with class A and 9500 with class B then both of these values are support value of their respective classes.
Micro Average
Micro Average is an average of true positive, false positive, and false negative while working with a multiclass classification problem.
Precision, Recall, and F1-Score all have Micro Average. Let’s see how it is calculated when we have three classes A, B, and C.
\begin{equation} \text {MA for Precision}=\frac{TP1+TP2+TP3}{TP1+TP2+TP3+FP1+FP2+FP3} \end{equation}
\begin{equation} \text {MA for Recall}=\frac{TP1+TP2+TP3}{TP1+TP2+TP3+FN1+FN2+FN3} \end{equation}
\begin{equation} \text {MA for F1-Score}=\frac{2 * MA\ for\ Precision * MA\ for\ Recall}{MA\ for\ Precision + MA\ for\ Recall} \end{equation}
In all three formulas above, TP1, TP2, TP3 represent true positive values of classes A, B, and C respectively and the same goes for false positive and false negative.
Micro Average of F1-Score is a harmonic mean of micro averages of Precision and Recall.
Macro Average
Macro Average is very simple. For Precision, it is an average of all the Precision values of multiple classes (i.e. A, B, and C). in the case of Recall also it is an average of all Recall values and the same goes for F1-Score.
For example, the micro average of precision would be an average of precision of classes A, B, and C.
Weighted Average
Weighted Average is an average measured by considering support values of multiple classes i.e. number of each class in input data.
For example, we have 3 classes A, B, and C then the formula for the weighted average for precision, recall, and f1-score will be like this:
Here, Support = S, Precision = P, Recall = R and F1-Score = F1 are used.
\begin{equation} \text {WA for Precision}=\frac{S(A) * P(A) + S(B) * P(B) + S(C) * P(C) }{S(A) + S(B) + S(C)} \end{equation}
\begin{equation} \text {WA for Recall}=\frac{S(A) * R(A) + S(B) * R(B) + S(C) * R(C) }{S(A) + S(B) + S(C)} \end{equation}
\begin{equation} \text {WA for F1-Score}=\frac{S(A) * F1(A) + S(B) * F1(B) + S(C) * F1(C) }{S(A) + S(B) + S(C)} \end{equation}
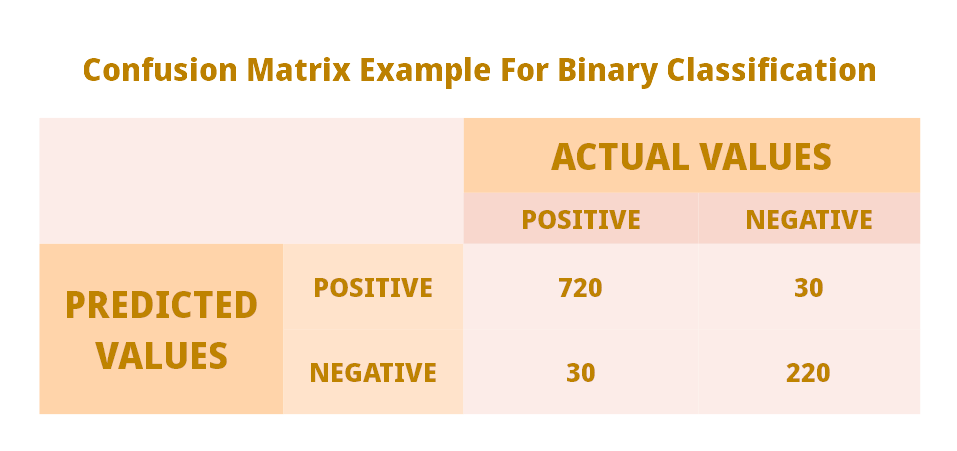
Example
Confusion Matrix
A confusion matrix is a matrix with actual and predicted values consist of true positive, false positive, true negative, and false negative counts.
Classification Report
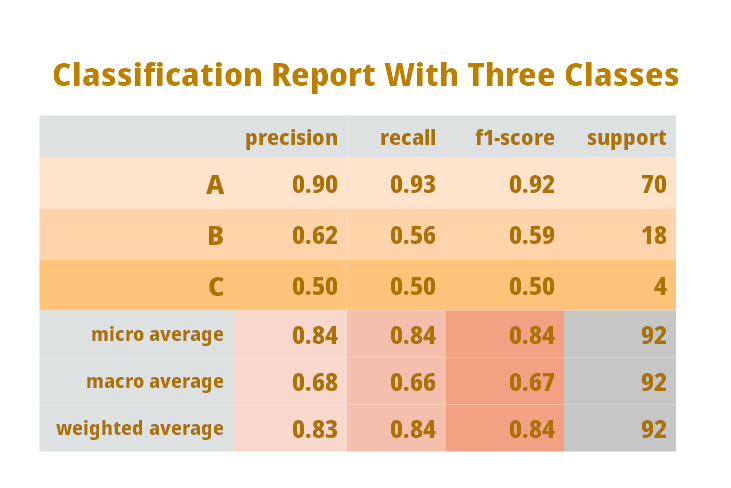
⦿ This is the same classification report that Python’s Sklearn library generates.
⦿ In the above diagram, we are dealing with three classes A, B, and C.
⦿ The total number of records in this example are 92 i.e. total of support values of A, B, and C.
⦿ The rest of the table is self-explanatory with terms discussed earlier, re-look definitions if required.
Conclusion
⦿ To compute the confusion matrix and classification report, Python’s Sklearn library has already implemented it and you just have to pass your actual and predicted data to it to get the results.
⦿ There are other ways of evaluating classification problems and those will be covered in future articles.
⦿ You can find all the classification evaluation metrics here: Classification Evaluation Metrics
Check out here article categories for more information: Article Categories